动态function tracer原理
fpatchable-function-entry选项
编译时指定-fpatchable-function-entry=N[,M],①会在函数入口第一个指令之前插入N个nop,但是会保留M个放到函数入口之前,如果省略M则默认为0;②同时需要一个特殊的-fpatchable-function-entry段来记录所有函数的入口,如下蓝色部分。nop指令保留了额外的空间,可用于在运行时修改nop指令,添加自己想要的桩点,前提是代码段可写的。
echo \'void test(){;}\' > test.c

$ riscv64-unknown-linux-gnu-gcc test.c -x c -c -fpatchable-function-entry=3,1 -S -o -
riscv64-unknown-linux-gnu-gcc: warning: \'-x c\' after last input file has no effect
        .file   \"test.c\"
        .option nopic
        .text
        .align  1
        .globl  test
        .section        __patchable_function_entries,\"aw\",@progbits
        .align  3
        .8byte  .LPFE1
        .text
.LPFE1:
        nop
        .type   test, @function
test:
        nop
        nop
        addi    sp,sp,-16
        sd      s0,8(sp)
        addi    s0,sp,16
        nop
        ld      s0,8(sp)
        addi    sp,sp,16
        jr      ra
        .size   test, .-test
        .ident  \"GCC: (Xuantie-900 linux-5.10.4 glibc gcc Toolchain V2.8.1 B-20240115) 10.4.0\"
        .section        .note.GNU-stack,\"\",@progbits
risc-v 内核编译与链接
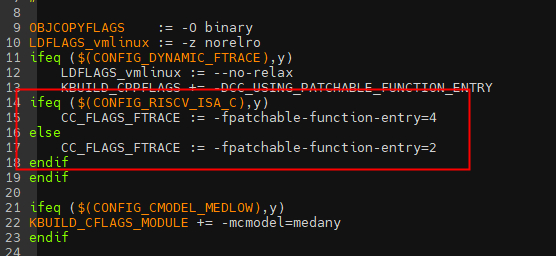
在本文的实验平台的RISC-V架构中,使用编译选项-fpatchable-function-entry进行编译,在内核arch/riscv/Makefile中指定CC_FLAGS_FTRACE:=-fpatchable-function-entry=X来编译内核组件。
添加上面参数后,编译后的目标文件,就会有两个特征:
– 每个函数入口,第一条指令前插入nop指令。
– 在__patchable_function_entries段重定位中,记录了当前目标文件所有函数入口地址。
Linux内核最终会链接合并成vmlinux.o,在链接重定位阶段会将所有.o中的__patchable_function_entries段重定位段信息合并起来。具体在链接脚本中include/asm-generic/vmlinux.lds.h中MCOUNT_REC的描述。如上图,nop指令的长度位2字节(16bit,用的是压缩指令c.nop),不管是多少位系统这是默认内核编译nop指令的长度,因此函数入口插入的nop总长度4*2字节=8字节,这8字节的nop会在开启函数跟踪的时候修改位对应长度的跳转指令,在启动过程中或函数跟踪关闭的时候修改位对应长度的nop。
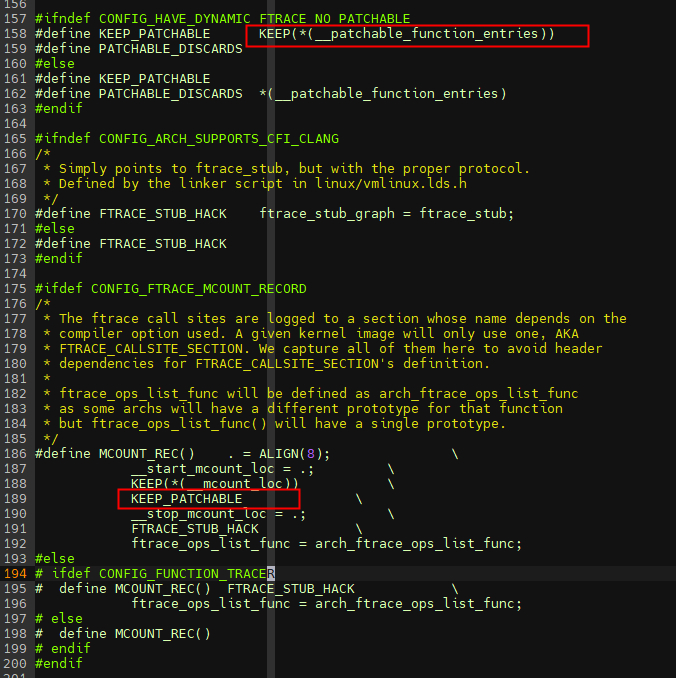
从上可知,可以通过__{start,stop}_mcount_loc符号获取到所有函数入口,同时每个函数入口都会插入nop指令,相当于定位了所有函数的入口在哪,后续就可以对指令进行修改,如下图所示。
为什么要用一个section来记录所有函数入口地址?这是因为记录的函数入口地址,就记录的nop指令的位置,在程序运行过程中才能把nop指令进行修改为指定的跟踪函数。在动态ftrace中,系统启动初始化时会将所有的函数入口地址记录到struct dyn_ftrace结构体中,3.4章节会介绍到。
桩点更新过程概览
接下来我们以函数vfs_read进行实例分析,从编译到系统启动,再到使能function trace这一过程来进行简单分析插装点变化。
编译插桩点
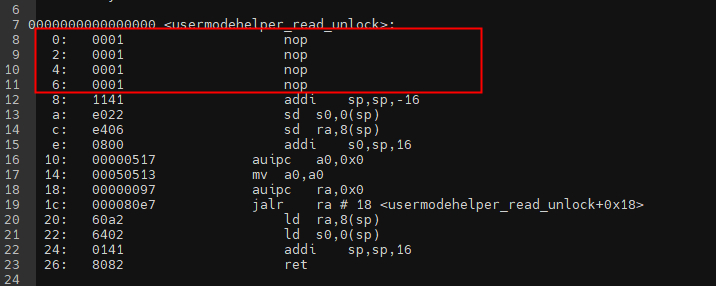
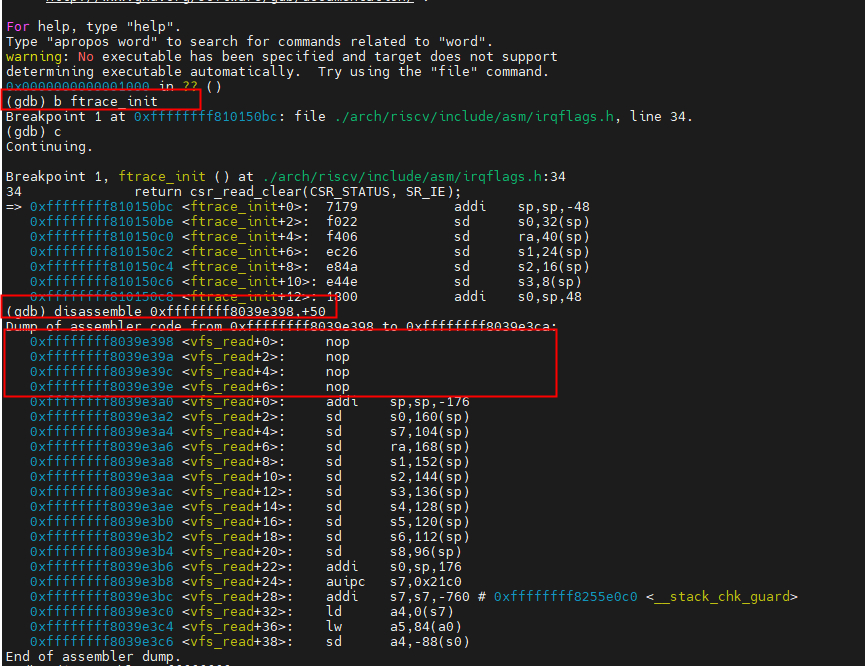
本文的实验平台=-fpatchable-function-entry=4,即编译完成后,需要在函数入口处插入4个nop指令,我们通过riscv64-unknown-linux-gnu-objdump -D vmlinux > log反汇编查看vfs_read如下:
ffffffff8039e398 :
ffffffff8039e398:   0001                    nop
ffffffff8039e39a:   0001                    nop
ffffffff8039e39c:   0001                    nop
ffffffff8039e39e:   0001                    nop
ffffffff8039e3a0:   7171                    addi    sp,sp,-176
ffffffff8039e3a2:   f122                    sd  s0,160(sp)
ffffffff8039e3a4:   f4de                    sd  s7,104(sp)
ffffffff8039e3a6:   f506                    sd  ra,168(sp)
ffffffff8039e3a8:   ed26                    sd  s1,152(sp)
ffffffff8039e3aa:   e94a                    sd  s2,144(sp)
ffffffff8039e3ac:   e54e                    sd  s3,136(sp)
ffffffff8039e3ae:   e152                    sd  s4,128(sp)
ffffffff8039e3b0:   fcd6                    sd  s5,120(sp)
ffffffff8039e3b2:   f8da                    sd  s6,112(sp)
ffffffff8039e3b4:   f0e2                    sd  s8,96(sp)
ffffffff8039e3b6:   1900                    addi    s0,sp,176
ffffffff8039e3b8:   021c0b97            auipc   s7,0x21c0
ffffffff8039e3bc:   d08b8b93            addi    s7,s7,-760 # ffffffff8255e0c0 <__stack_chk_guard>
ffffffff8039e3c0:   000bb703            ld  a4,0(s7)
ffffffff8039e3c4:   497c                    lw  a5,84(a0)
ffffffff8039e3c6:   fae43423            sd  a4,-88(s0)
ffffffff8039e3ca:   0017f713            andi    a4,a5,1
......
启动初始化调整nop指令长度
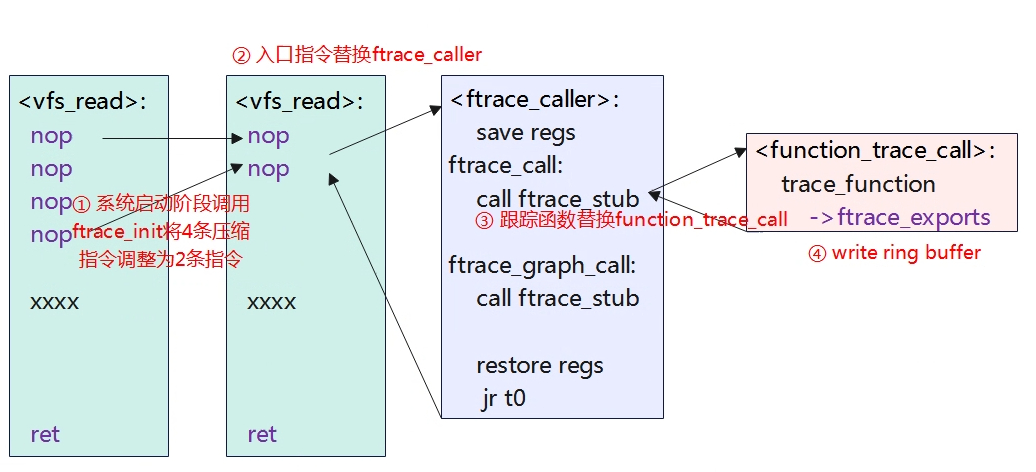
在系统启动阶段,会调用ftrace_init函数,将所有的入口函数地址记录到struct dyn_frtace实例结构中,然后将4个RV32C压缩指令替换为RV32I模式的nop指令,即原来的4个2字节长度的nop指令,将会拓展为2个4字节的拓展指令。
我们在系统启动时先在ftrace_init地方打断点,先观察vfs_read处的指令情况。disassemble 0xffffffff8039e398,+50查看地址开始的指令。(不能使用disassemble vfs_read,+50查看,这样会把前面的插桩过滤掉,需要使用地址的方式)。
可以看到,跟上一节中我们反汇编看到的指令是一致了,4条nop指令还没有被替换。接着我们使用n继续进行调试运行,当运行完ftrace_process_locs后,我们再来查看一下变化。
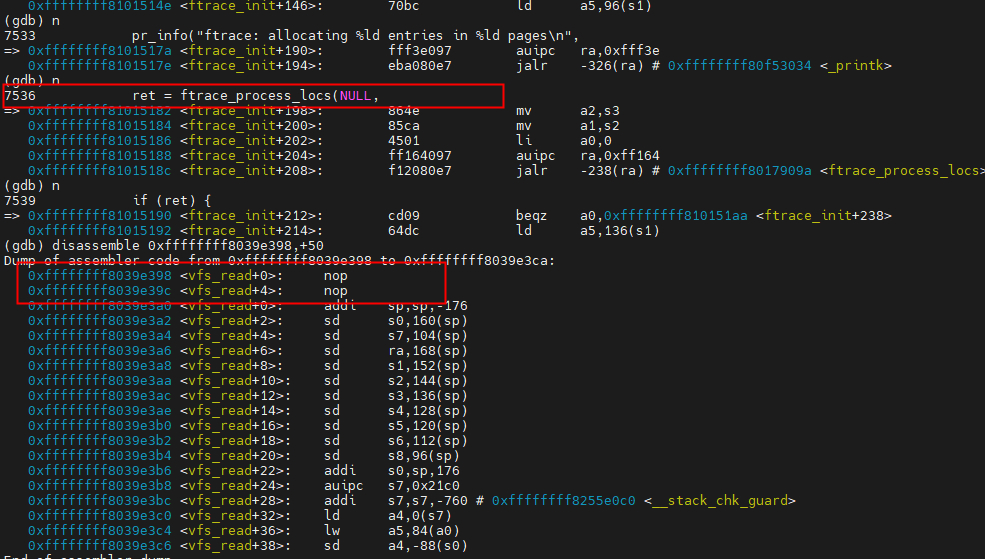
我们发现之前4条2字节的nop指令被替换成了2条4字节的nop指令了。为什么要调整nop指令的长度了,个人理解应该是为了兼顾处理器流水线的优化、指令对齐等,比如跳转到指定标签运行是auipc+jalr两条4字节的指令。之所以不在编译时就确定时因为延迟运行调整nop指令的长度,可以更好的平衡系统的兼容性和灵活性。
替换入口函数的nop
当我们使能function tracer后,nop指令就会被替换为ftrace_caller。接下来我们使能 echo function > /sys/kernel/debug/tracing/current_tracer再来看看vfs_read的情况。
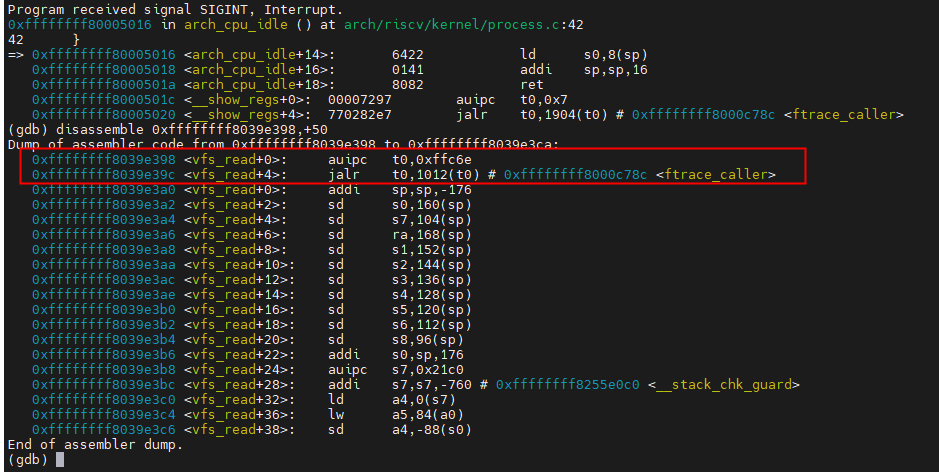
从上面可知,之前的2条nop指令就被替换为了auipc+jalr指令,即跳转到ftrace_caller函数。
替换跟踪函数ftrace_stub
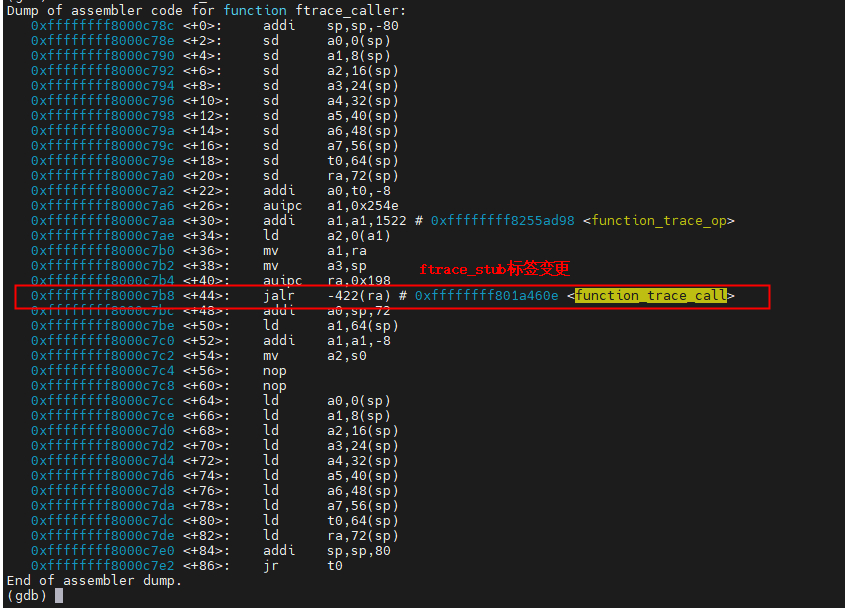
执行echo function >current_tracer时,除了函数入口的nop指令会被替换为ftrace_caller外,ftrace_caller的实现中,ftrace_stub也会替换为function_trace_call。更新代码会调用到ftrace_modify_all_code函数,我们对此函数进行断点观察前后变化。
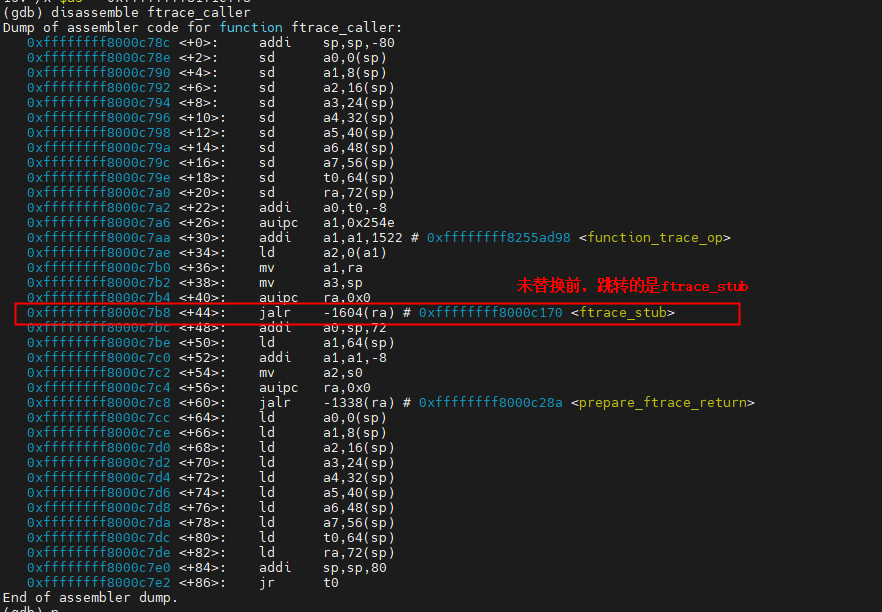
如上图,在还没有执行命令echo function > current_tracer时,ftrace_caller执行的是ftrace_stub,当执行命令后,就变成跳转如下i b。
具体的实例代码如下,切换前:
ENTRY(ftrace_caller)
    SAVE_ABI

    addi    a0, t0, -FENTRY_RA_OFFSET
    la  a1, function_trace_op
    REG_L   a2, 0(a1)
    mv  a1, ra
    mv  a3, sp

ftrace_call:
    .global ftrace_call
    call    ftrace_stub ①未执行echo function > current_tracer

    RESTORE_ABI
    jr t0
ENDPROC(ftrace_caller)
执行命令echo function > current_tracer后,ftrace_caller标签处就会变为如下:
ENTRY(ftrace_caller)
    SAVE_ABI

    addi    a0, t0, -FENTRY_RA_OFFSET
    la  a1, function_trace_op
    REG_L   a2, 0(a1)
    mv  a1, ra
    mv  a3, sp

ftrace_call:
    .global ftrace_call
    call    function_trace_call ①执行echo function > current_tracer

    RESTORE_ABI
    jr t0
ENDPROC(ftrace_caller)
ftrace_caller调用流程
gdb 调试继续跟踪ftrace_caller实现。
(gdb)

=> 0xffffffff8039e398 :     ffc6e297        auipc   t0,0xffc6e
   0xffffffff8039e39c :     3f4282e7        jalr    t0,1012(t0) # 0xffffffff8000c78c  ①进入vfs_read函数入口是,跳转到ftrace_caller,t0=PC+4,即0xffffffff8039e3a0
  0xffffffff8039e3a0 :     addi    sp,sp,-176
  0xffffffff8039e3a2 :     sd      s0,160(sp)
  .....

ftrace_caller () at arch/riscv/kernel/mcount-dyn.S:135
135             SAVE_ABI    ②开辟一段栈空间,将a0~a7,t0/ra入栈。
=> 0xffffffff8000c78c :        715d            addi    sp,sp,-80
   0xffffffff8000c78e :        e02a            sd      a0,0(sp)
   0xffffffff8000c790 :        e42e            sd      a1,8(sp)
   0xffffffff8000c792 :        e832            sd      a2,16(sp)
   0xffffffff8000c794 :        ec36            sd      a3,24(sp)
   0xffffffff8000c796 :       f03a            sd      a4,32(sp)
   0xffffffff8000c798 :       f43e            sd      a5,40(sp)
   0xffffffff8000c79a :       f842            sd      a6,48(sp)
   0xffffffff8000c79c :       fc46            sd      a7,56(sp)
   0xffffffff8000c79e :       e096            sd      t0,64(sp)
   0xffffffff8000c7a0 :       e486            sd      ra,72(sp)
137             addi    a0, t0, -FENTRY_RA_OFFSET ②获取vfs_read的入口地址。
=> 0xffffffff8000c7a2 :       ff828513        addi    a0,t0,-8
138             la      a1, function_trace_op ③获取全局变量function_trace_op,这是ftrace的操作集合,包含了ftrace的函数。
=> 0xffffffff8000c7a6 :       0254e597        auipc   a1,0x254e
   0xffffffff8000c7aa :       5f258593        addi    a1,a1,1522 # 0xffffffff8255ad98
139             REG_L   a2, 0(a1) ④获取ftrace_trace_op地址存储到a2中。
=> 0xffffffff8000c7ae :       6190            ld      a2,0(a1)
140             mv      a1, ra
141             mv      a3, sp
145             call    ftrace_stub
=> 0xffffffff8000c7b4 :       00198097        auipc   ra,0x198
   0xffffffff8000c7b8 :       e5a080e7        jalr    -422(ra) # 0xffffffff801a460e

at kernel/trace/trace_functions.c:175
function_trace_call(unsigned long ip, unsigned long parent_ip,struct ftrace_ops *op, struct ftrace_regs *fregs)
  ⑤ ip为入口函数vfs_read的地址即a0, parent_ip为vfs_read的父函数,调用vfs_read地址处的下一条指令。op为ftrace_trace_op,fregs为栈地址。
  trace_function
entry   = ring_buffer_event_data(event);
entry->ip           = ip;
entry->parent_ip        = parent_ip;
ftrace_exports(event, TRACE_EXPORT_FUNCTION); ⑥ 将信息写入到ring buffer中。
  while(export) {
    trace_process_export(export, event, flag);
      export->write(export, entry, size);
}

ftrace_caller () at arch/riscv/kernel/mcount-dyn.S:148
148             addi    a0, sp, ABI_RA
149             REG_L   a1, ABI_T0(sp)
150             addi    a1, a1, -FENTRY_RA_OFFSET
152             mv      a2, s0
156             call    ftrace_stub  ⑦对function graph tracer进行处理,当前使能的是function tracer,所以ftrace_stub函数直接直接为ret,如下。
ftrace_stub () at arch/riscv/kernel/mcount.S:55
55              ret
=> 0xffffffff8000c170 :  8082            ret
   0xffffffff8000c172 :    0001            nop
ftrace_caller () at arch/riscv/kernel/mcount-dyn.S:158
158             RESTORE_ABI   ⑧恢复寄存器,准备返回。
ftrace_caller () at arch/riscv/kernel/mcount-dyn.S:159
159             jr t0
=> 0xffffffff8000c7e2 :       8282            jr      t0
总结一下:
ftrace_caller
  call    ftrace_stub  =>  call  function_trace_call
trace_function
  ftrace_exports
    export->write(export, entry, size)
从上可知,ftrace_stub被赋值为function_trace_call,该函数是什么时候被替换的了?我们留着后续进行3.5章节进行分析。
ftrace_init
ftrace_init通过读取__{start,stop}_mcount_loc字段中记录所有的函数入口地址,所有的入口地址被记录到最小的实例struct dyn_ftrace结构体中,这些结构体最终打包形成pg链表节点,首节点为start_pg,遍历start_pg链表执行ftrace_init_nop把4个nop指令。
数据结构
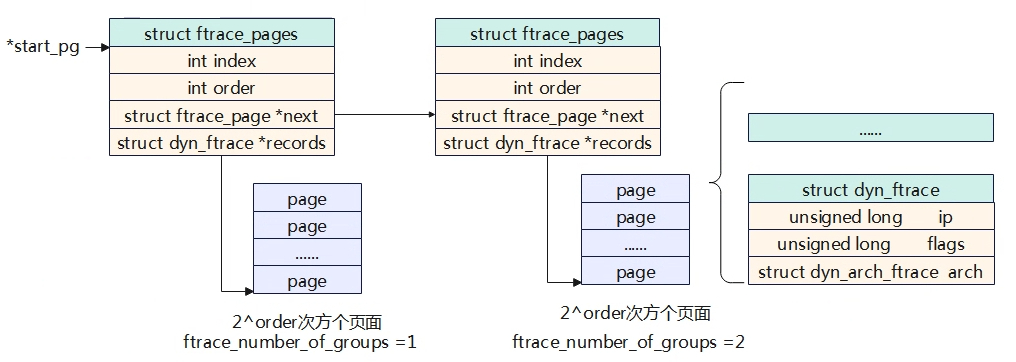
在section中__{start,stop}_mcount_loc字段中记录所有的函数入口地址,每个函数入口地址都有一个struct dyn_ftrace数据结构实例来记录。每个页面(page)可以存放多个struct_ftrace实例,多个页面组成一个groups。每个组使用struct ftrace_pages节点来进行管理,多个struct ftrace_pages组成一个链表,具体的结构如上图所示。
void __init ftrace_init(void)
{
    extern unsigned long __start_mcount_loc[];
extern unsigned long __stop_mcount_loc[];
① _start_mcount_loc和_stop_mcount_loc分别是所有入口函数段的开始和结束。
    unsigned long count, flags;
    int ret;

    local_irq_save(flags);
    ret = ftrace_dyn_arch_init();
    local_irq_restore(flags);
    if (ret)
        goto failed;

    count = __stop_mcount_loc - __start_mcount_loc;
    if (!count) {
        pr_info(\\\"ftrace: No functions to be traced?\\\\n\\\");
        goto failed;
    }

    pr_info(\\\"ftrace: allocating %ld entries in %ld pages\\\\n\\\",
        count, DIV_ROUND_UP(count, ENTRIES_PER_PAGE));
② count所有的插桩点的总数,DIV_ROUND_UP(count, ENTRIES_PER_PAGE))表示需要分配多少个pages,每个插桩点都使用struct dyn_ftrace来记录。下面是qumu上的打印
 [    0.000000] ftrace: allocating 37736 entries in 148 pages
一共有37736个插桩点,需要148 * 4KB=592KB的内存。
    ret = ftrace_process_locs(NULL,
                  __start_mcount_loc,
                  __stop_mcount_loc);
    if (ret) {
        pr_warn(\\\"ftrace: failed to allocate entries for functions\\\\n\\\");
        goto failed;
    }
   ③ 将所有的插桩点地址记录到struct dyn_ftrace实例中,如数据结构图中,每个插桩点都有要给struct dyn_ftrace实例,实例空间分配page,每个page有多个struct dyn_ftrace的实例。然后遍历地址将4条nop指令调整为2条nop指令(本章节的实验)。
    pr_info(\\\"ftrace: allocated %ld pages with %ld groups\\\\n\\\",
        ftrace_number_of_pages, ftrace_number_of_groups);

    last_ftrace_enabled = ftrace_enabled = 1;
   ④设置过滤?
    set_ftrace_early_filters();

    return;
 failed:
    ftrace_disabled = 1;
}
分配数据结构
static int ftrace_process_locs(struct module *mod,
                   unsigned long *start,
                   unsigned long *end)
{
    struct ftrace_page *start_pg;
    struct ftrace_page *pg;
    struct dyn_ftrace *rec;
    unsigned long count;
    unsigned long *p;
    unsigned long addr;
    unsigned long flags = 0; /* Shut up gcc */
    int ret = -ENOMEM;

    count = end - start;

    if (!count)
        return 0;


    start_pg = ftrace_allocate_pages(count);
    if (!start_pg)
        return -ENOMEM;
    ① 分配ftrace page,里面存放的是struct dyn_ftrace,具体结构如3.3.1数据结构图,用于后续存放地址。
......
}
记录插桩地址
static int ftrace_process_locs(struct module *mod,
                   unsigned long *start,
                   unsigned long *end)
{
    ......
    p = start;
    pg = start_pg;
    while (p < end) {
        unsigned long end_offset;
        addr = ftrace_call_adjust(*p++);
        /*
         * Some architecture linkers will pad between
         * the different mcount_loc sections of different
         * object files to satisfy alignments.
         * Skip any NULL pointers.
         */
        if (!addr)
            continue;

        end_offset = (pg->index+1) * sizeof(pg->records[0]);
        if (end_offset > PAGE_SIZE << pg->order) {
            /* We should have allocated enough */
            if (WARN_ON(!pg->next))
                break;
            pg = pg->next;
        }

        rec = &pg->records[pg->index++];
        rec->ip = addr;
       ② 遍历将所有的插桩点地址存储到struct dyn_ftrace中。
}
......
}
更新插桩指令nop
static int ftrace_process_locs(struct module *mod,
                   unsigned long *start,
                   unsigned long *end)
{
......

   if (!mod)
        local_irq_save(flags);
    ftrace_update_code(mod, start_pg);
    if (!mod)
        local_irq_restore(flags);

......
}
ftrace_update_code(mod, start_pg);
    for (pg = new_pgs; pg; pg = pg->next) {
        ftrace_nop_initialize(mod, p)
            ftrace_init_nop(mod, rec)
            out = ftrace_make_nop(mod, rec, MCOUNT_ADDR);
                unsigned int nops[2] = {NOP4, NOP4};
                patch_text_nosync((void *)rec->ip, nops, MCOUNT_INSN_SIZE)
                    patch_insn_write(tp, insns, len)
                        addr = patch_map(addr, FIX_TEXT_POKE0); //fixmap FIX_TEXT_POKE0映射地址
                        ret = copy_to_kernel_nofault(waddr, insn, len);
                            pagefault_disable() //关掉缺页异常
                            copy_to_kernel_nofault_loop(dst, src, size, u64, Efault)
                                __put_kernel_nofault
                                __put_user_nocheck
                                    __put_user_asm(\\\"sw\\\", (x), __gu_ptr, __pu_err) //写内存指令
                            pagefault_disable()
                        patch_unmap(FIX_TEXT_POKE0);
}
入口函数与跟踪函数替换
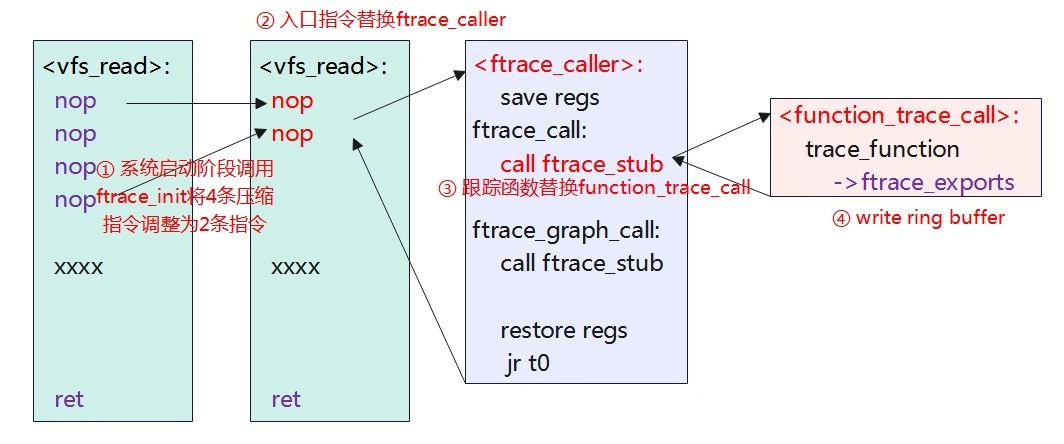
- 入口函数:两条nop指令替换为ftrace_caller。
- 跟踪函数:call ftrace_stub替换为call function_trace_call。
前面描述了使能function tracer后会将nop指令替换为ftrace_caller和将ftrace_stub替换为function_trace_call。当echo function > current_tracer就会通过文件系统调用到tracing_set_trace_write函数,本章节从该函数来具体分析下替换过程。
tracing_set_trace_write(struct file *filp, const char __user *ubuf,
            size_t cnt, loff_t *ppos)
err = tracing_set_tracer(tr, name)
    for (t = trace_types; t; t = t->next) {
        if (strcmp(t->name, buf) == 0)
            break;
}
①trace有很多个类型,匹配function类型获取到struct tracer *t。
   if (t->init) {
        ret = tracer_init(t, tr);
        if (ret)
            goto out;
    }
   ②调用对应tracer的初始化函数,我们这里使能的是function,因此调用的是function_trace_init
每个tracer都有一个对应的实例,对应function类型的tracer实例如下,会调用register_tracer(&function_trace)函数进行注册tracer。
static struct tracer function_trace __tracer_data =
{
    .name       = \\\"function\\\",
    .init       = function_trace_init,
    .reset      = function_trace_reset,
    .start      = function_trace_start,
    .flags      = &func_flags,
    .set_flag   = func_set_flag,
    .allow_instances = true,
};
接下来,接着看看function_trace_init函数实现。
static int function_trace_init(struct trace_array *tr)
{
    ftrace_func_t func;

    func = select_trace_function(func_flags.val);
    if (!func)
        return -EINVAL;
①根据func_flags.val来选择跟踪函数,这里默认选择function_trace_call

    if (!handle_func_repeats(tr, func_flags.val))
        return -ENOMEM;

    ftrace_init_array_ops(tr, func);
② 设置struct ftrace_ops.func = function_trace_call

    tr->array_buffer.cpu = raw_smp_processor_id();

    tracing_start_cmdline_record();
tracing_start_function_trace(tr);
③ 注册ftrace_function
    return 0;
}
全局ftrace_ops_list
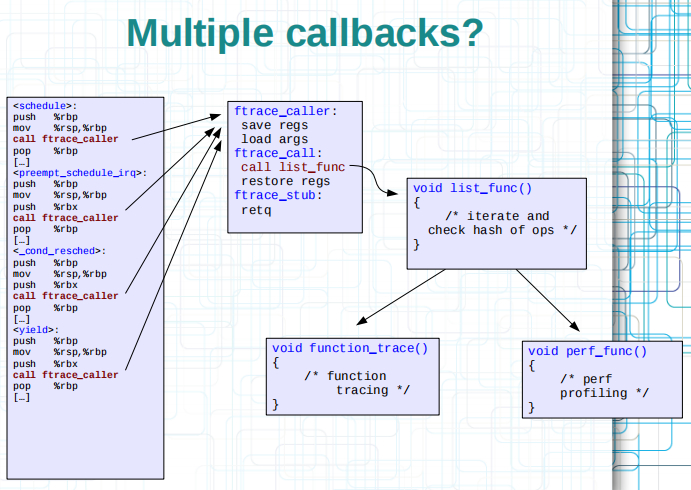
如上图,ftrace_call的地方可以需要trace function,也要用于perf,那么就会再perf和function trace上面再封装一层,把ftrace_stub替换为ftrace_ops_list_func,在系统中ftrace_ops_list_func = arch_ftrace_ops_list_func。
void arch_ftrace_ops_list_func(unsigned long ip, unsigned long parent_ip,
                   struct ftrace_ops *op, struct ftrace_regs *fregs)
{
    __ftrace_ops_list_func(ip, parent_ip, NULL, fregs);
}

static nokprobe_inline void
__ftrace_ops_list_func(unsigned long ip, unsigned long parent_ip,
               struct ftrace_ops *ignored, struct ftrace_regs *fregs)
{
    struct pt_regs *regs = ftrace_get_regs(fregs);
    struct ftrace_ops *op;
    int bit;

    /*
     * The ftrace_test_and_set_recursion() will disable preemption,
     * which is required since some of the ops may be dynamically
     * allocated, they must be freed after a synchronize_rcu().
     */
    bit = trace_test_and_set_recursion(ip, parent_ip, TRACE_LIST_START);
    if (bit < 0)
        return;
    ftrace_ops_list是一个struct ftrace_ops类型的链表,每个ftrace_ops代表一个ftrace函数跟踪类型,默认是遍历ftrace_ops_list,调用ops函数
    do_for_each_ftrace_op(op, ftrace_ops_list) {
        /* Stub functions don\\\'t need to be called nor tested */
        if (op->flags & FTRACE_OPS_FL_STUB)
            continue;
        /*
         * Check the following for each ops before calling their func:
         *  if RCU flag is set, then rcu_is_watching() must be true
         *  Otherwise test if the ip matches the ops filter
         *
         * If any of the above fails then the op->func() is not executed.
         */
        if ((!(op->flags & FTRACE_OPS_FL_RCU) || rcu_is_watching()) &&
            ftrace_ops_test(op, ip, regs)) {
            if (FTRACE_WARN_ON(!op->func)) {
                pr_warn(\\\"op=%p %pS\\\\n\\\", op, op);
                goto out;
            }
            op->func(ip, parent_ip, op, fregs);
        }
    } while_for_each_ftrace_op(op);
out:
    trace_clear_recursion(bit);
}
ftrace_ops数据结构:
struct ftrace_ops {
    ftrace_func_t           func;  //替换ftrace_stub的函数
    struct ftrace_ops __rcu     *next;
    unsigned long           flags;
    void                *private;
    ftrace_func_t           saved_func;
#ifdef CONFIG_DYNAMIC_FTRACE
    struct ftrace_ops_hash      local_hash;
    struct ftrace_ops_hash      *func_hash;
    struct ftrace_ops_hash      old_hash;
    unsigned long           trampoline;
    unsigned long           trampoline_size;
    struct list_head        list;
    ftrace_ops_func_t       ops_func;
#endif
};
默认的ftrace_ops为:
struct ftrace_ops global_ops = {
    .func               = ftrace_stub,
    .local_hash.notrace_hash    = EMPTY_HASH,
    .local_hash.filter_hash     = EMPTY_HASH,
    INIT_OPS_HASH(global_ops)
    .flags              = FTRACE_OPS_FL_INITIALIZED |
                      FTRACE_OPS_FL_PID,
};
如果头结点是 ftrace_list_end,表示没有ops注册,代表无需函数跟踪,将 func 设置为空的跟踪函数 ftrace_stub。
如果头结点的下一个结点是 ftrace_list_end,表示只有一个ops注册,且当此ops不是动态ops(比如:livepatch),且架构支持传递 ops 到跟踪函数,则将 func 设置为 ops->func,否则设置为 ftrace_ops_list_func()
如果链表中有不止一个的 ops 注册,则将 func 设置为 ftrace_ops_list_func()
ftrace_ops_list_func() 为区别于全局跟踪函数,我们在此称之为列表跟踪函数。此函数在 vmlinux 链接时,指向 arch_ftrace_ops_list_func,执行时会遍历 ftrace_ops_list,结合 ops->func_hash 来判断是否需要对当前 ip 执行 ops->func,也就是说 ftrace_ops_list_func() 不仅会调用多个 ops 的跟踪函数,也会保证 ops 跟踪函数处理的函数是应该被跟踪的。
本实验是将func 设置到 ftrace_trace_function()。当前设置 function tracer 的流程中,ops 就是 global_ops 且 ftrace_ops_list 链表只有 global_ops 这一个注册。
注册ftrace_function
int register_ftrace_function(struct ftrace_ops *ops)
{
    ret = register_ftrace_function_nolock(ops);
    ret = ftrace_startup(ops, 0);
}
int ftrace_startup(struct ftrace_ops *ops, int command)
{
    int ret;

    if (unlikely(ftrace_disabled))
        return -ENODEV;

    ret = __register_ftrace_function(ops);
    if (ret)
        return ret;
    ①添加ops(global_ops)到全局ops链表ftrace_ops_list中,并设置全局跟踪函数ftrace_trace_function为ops->func。

    ftrace_start_up++;

    ops->flags |= FTRACE_OPS_FL_ENABLED | FTRACE_OPS_FL_ADDING;
 ②根据ops->func_hash->filter_hash更新入口函数表中每个函数记录rec的ip modfy位。
    ret = ftrace_hash_ipmodify_enable(ops);
    if (ret < 0) {
        /* Rollback registration process */
        __unregister_ftrace_function(ops);
        ftrace_start_up--;
        ops->flags &= ~FTRACE_OPS_FL_ENABLED;
        if (ops->flags & FTRACE_OPS_FL_DYNAMIC)
            ftrace_trampoline_free(ops);
        return ret;
}

    if (ftrace_hash_rec_enable(ops, 1))
        command |= FTRACE_UPDATE_CALLS;
③判断是否有函数入口需要更新,如果需要更新则command设置为FTRACE_UPDATE_CALLS。
这里的入口函数就是替换nop指令。入口函数的替换和跟踪函数替换是不一样的,注意区分。
    ftrace_startup_enable(command);
    ④判断报错的跟踪函数saved_ftrace_func与当前跟踪函数ftrace_trace_function是否相同,如果不同则表示需要更新跟踪函数,command设置为FTRADE_UPDATE_TRACE_FUNC,之后执行ftrace_run_update_code进行更新。
    /*
     * If ftrace is in an undefined state, we just remove ops from list
     * to prevent the NULL pointer, instead of totally rolling it back and
     * free trampoline, because those actions could cause further damage.
     */
    if (unlikely(ftrace_disabled)) {
        __unregister_ftrace_function(ops);
        return -ENODEV;
    }

    ops->flags &= ~FTRACE_OPS_FL_ADDING;

    return 0;
}
int __register_ftrace_function(struct ftrace_ops *ops)
{

add_ftrace_ops(&ftrace_ops_list, ops);
① 将目标trace添加到全局链表ftrace_ops_list中。

    /* Always save the function, and reset at unregistering */
    ops->saved_func = ops->func;
    ② 保存当前要trace的函数。
    if (ftrace_pids_enabled(ops))
        ops->func = ftrace_pid_func;
    ③ 如果设置的特定pid 进行trace,将trace函数更新为 ftrace_pid_func,即ftrace_stub更新为ftrace_pid_func
    ftrace_update_trampoline(ops);

    if (ftrace_enabled)
        update_ftrace_function();
④ 将当前的trace函数赋值到ftrace_trace_function中,表示当前要修改的目标函数。
    return 0;
}
函数过滤处理
如果设置了过滤函数不需要进行跟踪,需对相应的桩点实例dyn_ftrace设置标记,FTRACE_FL_DISABLED标志表示不需要更新入口函数,FTRACE_FL_IPMODIFY表示需要更新。需要过滤的函数,统一记录在ops->func_hash->filter_hash表中。
static int __ftrace_hash_update_ipmodify(struct ftrace_ops *ops,
                     struct ftrace_hash *old_hash,
                     struct ftrace_hash *new_hash)
{
   /* Update rec->flags */
do_for_each_ftrace_rec(pg, rec) {
  遍历所有插桩点,是否需要过滤掉,打上对应的标记。
} while_for_each_ftrace_rec();

}
ftrace modify all code
如果要更新入口函数,标志设置为 FTRACE_UPDATE_CALLS;如果要更新跟踪函数,标志设置为FTRACE_UPDATE_TRACE_FUNC。如果使能了ftrace gragh,则标志设置为FTRACE_START_FUNC_RET。
void ftrace_modify_all_code(int command)
{
    int update = command & FTRACE_UPDATE_TRACE_FUNC;
    int mod_flags = 0;
    int err = 0;
    if (update) {
        err = update_ftrace_func(ftrace_ops_list_func);
        if (FTRACE_WARN_ON(err))
            return;
     }
    ① 先将跟踪函数替换为ftrace_ops_list_func。

    if (command & FTRACE_UPDATE_CALLS)
        ftrace_replace_code(mod_flags | FTRACE_MODIFY_ENABLE_FL);
    else if (command & FTRACE_DISABLE_CALLS)
        ftrace_replace_code(mod_flags);
②更新入口函数

    if (update && ftrace_trace_function != ftrace_ops_list_func) {
        function_trace_op = set_function_trace_op;
        smp_wmb();
        /* If irqs are disabled, we are in stop machine */
        if (!irqs_disabled())
            smp_call_function(ftrace_sync_ipi, NULL, 1);
        err = update_ftrace_func(ftrace_trace_function);
        if (FTRACE_WARN_ON(err))
            return;
    }
    ③ 判断ftrace_trace_function != ftrace_ops_list_func,则重新将跟踪函数更新为ftrace_trace_function 。
    if (command & FTRACE_START_FUNC_RET)
        err = ftrace_enable_ftrace_graph_caller();
    else if (command & FTRACE_STOP_FUNC_RET)
        err = ftrace_disable_ftrace_graph_caller();
更新跟踪函数
static int update_ftrace_func(ftrace_func_t func)
ftrace_update_ftrace_func(ftrace_func_t func)
    int ret = __ftrace_modify_call((unsigned long)&ftrace_call,
                       (unsigned long)func, true, true);
    if (!ret) {
        ret = __ftrace_modify_call((unsigned long)&ftrace_regs_call,
                       (unsigned long)func, true, true);


static int __ftrace_modify_call(unsigned long hook_pos, unsigned long target,
                bool enable, bool ra)
{
    unsigned int call[2];
    unsigned int nops[2] = {NOP4, NOP4};

    if (ra)
        make_call_ra(hook_pos, target, call);
    else
        make_call_t0(hook_pos, target, call);
    计算跟踪函数的指令,修改地址ftrace_call或ftrace_regs_call处的跳转地址,默认是ftrace_stub,即完成了ftrace_call标签处的跳转替换,跟踪函数替换完成。
    /* Replace the auipc-jalr pair at once. Return -EPERM on write error. */
    if (patch_text_nosync
        ((void *)hook_pos, enable ? call : nops, MCOUNT_INSN_SIZE))
        return -EPERM;
    patch_text_nosync函数在3.4.4章节有简述,这里就不再重复。
    return 0;
}
更新入口函数
void __weak ftrace_replace_code(int mod_flags)
{
    struct dyn_ftrace *rec;
    struct ftrace_page *pg;
    bool enable = mod_flags & FTRACE_MODIFY_ENABLE_FL;
    int schedulable = mod_flags & FTRACE_MODIFY_MAY_SLEEP_FL;
    int failed;

    if (unlikely(ftrace_disabled))
        return;
    ① 遍历每个入口函数的,获取对应的dyn_ftrace实例。
    do_for_each_ftrace_rec(pg, rec) {
② 如果函数入口不需要更新,则循环继续(判断是否设置FTRACE_FL_DISABLED)
        if (skip_record(rec))
            continue;

        failed = __ftrace_replace_code(rec, enable);
        ③ 将函数入口地址替换(默认为nop)
        if (failed) {
            ftrace_bug(failed, rec);
            /* Stop processing */
            return;
        }
        if (schedulable)
            cond_resched();
    } while_for_each_ftrace_rec();
}


static int
__ftrace_replace_code(struct dyn_ftrace *rec, bool enable)
{
    unsigned long ftrace_old_addr;
    unsigned long ftrace_addr;
    int ret;

    ftrace_addr = ftrace_get_addr_new(rec);
    ① 获取要在函数入口要插桩点的函数地址。返回结果有有以下几种情况:
       -  FTRACE_FL_DIRECT: 在direct_functions中获取(用户自定义?)
       -  FTRACE_FL_TRAMP: 跳板函数?
       -  FTRACE_FL_REGS:FTRACE_REGS_ADDR,默认为ftrace_regs_caller
       -  默认: FTRACE_ADDR ,默认为ftrace_caller
    /* This needs to be done before we call ftrace_update_record */
    ftrace_old_addr = ftrace_get_addr_curr(rec);

    ret = ftrace_update_record(rec, enable);

    ftrace_bug_type = FTRACE_BUG_UNKNOWN;

    switch (ret) {
    case FTRACE_UPDATE_IGNORE:
        return 0;

    case FTRACE_UPDATE_MAKE_CALL:
        ftrace_bug_type = FTRACE_BUG_CALL;
        return ftrace_make_call(rec, ftrace_addr);

    case FTRACE_UPDATE_MAKE_NOP:
        ftrace_bug_type = FTRACE_BUG_NOP;
        return ftrace_make_nop(NULL, rec, ftrace_old_addr);

    case FTRACE_UPDATE_MODIFY_CALL:
        ftrace_bug_type = FTRACE_BUG_UPDATE;
        return ftrace_modify_call(rec, ftrace_old_addr, ftrace_addr);
    }
    ② 将入口函数的桩点替换为指定标签函数。
    return -1; /* unknown ftrace bug */
}
总结
本章节,我们重点分析了function tracer使能后的实现过程,分析了如何将函数入口替换为ftrace_caller,分析了ftrace_caller中ftrace_call标签处如何被替换成跳转到ftrace_trace_function。整个ftrace动态过程主要实现了以下功能
– 能够指定内核函数入口进行指令替换,使其跳转到ftrace_caller。
– 能够对跟踪函数进行更新,使指定的跟踪函数能够被调用。
在动态函数的跟踪分析过程中,register_ftrace_function和ftrace_set_filter这两个函数至关重要,这两个函数使能function tracer的时候会调用并触发指令替换和跟踪函数更新动作。同时这两个函数也是接口,用户可以通过调用这两个函数实现自己的tracer。
/**
 * register_ftrace_function - register a function for profiling
 * @ops:    ops structure that holds the function for profiling.
 *
 * Register a function to be called by all functions in the
 * kernel.
 *
 * Note: @ops->func and all the functions it calls must be labeled
 *       with \\\"notrace\\\", otherwise it will go into a
 *       recursive loop.
 */
int register_ftrace_function(struct ftrace_ops *ops)
{
    int ret;

    lock_direct_mutex();
    ret = prepare_direct_functions_for_ipmodify(ops);
    if (ret < 0)
        goto out_unlock;

    ret = register_ftrace_function_nolock(ops);

out_unlock:
    unlock_direct_mutex();
    return ret;
}
EXPORT_SYMBOL_GPL(register_ftrace_function);
register_ftrace_function是一个通用的注册函数,传递的参数struct ftrace_ops *ops即想要在函数入口插入跟踪的函数,无论是function tracer、irqsoff、fprobes、trace_event等函数都是调用该函数进行注册插桩,也可以自定义自己想要插桩的函数。
从原理上来讲,使能了-fpatchable-function-entry编译参数后,入口函数处就占了坑位,默认是先用nop指令填充,那么可以在运行阶段想换成啥就换成啥。